Management· 12 min read· Dishment team
Restaurant menu engineering: the matrix and ABC analysis, with a worked example
Restaurant menu engineering in plain words: the four-quadrant matrix and ABC analysis on a 12-dish Baku cafe menu in AZN, what to do with each group, menu design and how often to repeat it.
A menu has 40 items, yet 8 to 10 of them bring in most of the money. The rest take up kitchen time, tie up stock and make the guest's choice harder. Restaurant menu engineering turns this into numbers: how much each dish sells and how much money each portion leaves you.
This guide walks through two simple tools, ABC analysis and the menu engineering matrix, on the menu of a 12-dish cafe in Baku, step by step and in manat. All prices and sales figures are illustrative: plug in the numbers from your own till reports.
What restaurant menu engineering is
Menu engineering looks at every dish through two questions:
- Is it popular? Does it sell enough compared with the other items on the menu?
- Is it profitable? Is its contribution margin per portion (selling price − food cost) above the menu average?
The approach was introduced in 1982 by Michael Kasavana and Donald Smith of Michigan State University in their book "Menu Engineering". The two answers place each dish in one of four groups:
| Margin above average | Margin below average | |
|---|---|---|
| Popular | Star | Plowhorse |
| Sells little | Puzzle | Dog |
The key idea: think in manat, not in percentages. A dish with a 42% food cost can earn more than one with 20%, if more manat stay with you from each portion. How to work out food cost itself is covered step by step in our food cost guide.
ABC analysis: by revenue and by margin
ABC analysis is simpler and rests on the Pareto principle. Sort dishes by revenue from largest to smallest and add up their shares:
- Group A: the dishes that make up the first 80% of revenue. They carry the menu.
- Group B: the next 15%.
- Group C: the remaining 5%. These get questioned first.
You can run ABC by revenue, by the number of portions sold or by margin (revenue − food cost). ABC by revenue answers "who fills the till", ABC by margin answers "who earns the money". The gap can be large: a cheap best seller can be A on revenue and B on margin.
ABC's weak spot is that it blends popularity and profit into one number. So ABC tells you where to look, and the matrix tells you what to do. Use both.
A worked example: a 12-dish Baku cafe menu in AZN
Say a 40-seat cafe sold these dishes in a month. Food cost comes from the recipe card; the figures are illustrative.
| Dish | Price | Food cost | Food cost % | Sold per month | Margin per portion | Total margin |
|---|---|---|---|---|---|---|
| Plov | 14.00 ₼ | 4.30 ₼ | 30.7% | 420 | 9.70 ₼ | 4,074 ₼ |
| Lula kebab | 12.00 ₼ | 4.60 ₼ | 38.3% | 610 | 7.40 ₼ | 4,514 ₼ |
| Tika kebab (lamb pieces) | 15.00 ₼ | 6.40 ₼ | 42.7% | 380 | 8.60 ₼ | 3,268 ₼ |
| Vine-leaf dolma | 9.00 ₼ | 2.70 ₼ | 30.0% | 520 | 6.30 ₼ | 3,276 ₼ |
| Herb qutab (3 pcs) | 4.50 ₼ | 0.90 ₼ | 20.0% | 900 | 3.60 ₼ | 3,240 ₼ |
| Meat qutab (3 pcs) | 6.00 ₼ | 2.10 ₼ | 35.0% | 450 | 3.90 ₼ | 1,755 ₼ |
| Dovgha (yoghurt soup) | 4.00 ₼ | 0.80 ₼ | 20.0% | 260 | 3.20 ₼ | 832 ₼ |
| Dushbara (dumpling soup) | 7.00 ₼ | 1.90 ₼ | 27.1% | 140 | 5.10 ₼ | 714 ₼ |
| Chicken kebab | 10.00 ₼ | 3.10 ₼ | 31.0% | 300 | 6.90 ₼ | 2,070 ₼ |
| Sturgeon kebab | 28.00 ₼ | 13.50 ₼ | 48.2% | 90 | 14.50 ₼ | 1,305 ₼ |
| Tea set (for two, with jam) | 12.00 ₼ | 2.20 ₼ | 18.3% | 700 | 9.80 ₼ | 6,860 ₼ |
| Pakhlava | 5.00 ₼ | 1.60 ₼ | 32.0% | 160 | 3.40 ₼ | 544 ₼ |
| Total | 31.1% | 4,930 | 32,452 ₼ |
Monthly revenue is 47,070 ₼, ingredients cost 14,618 ₼, and the dishes leave a total margin of 32,452 ₼.
Step 1: the ABC result
By revenue, 7 dishes fall into group A: the tea set, lula kebab, plov, tika kebab, dolma, herb qutab and chicken kebab. Together they bring in about 83% of revenue. Group B holds meat qutab, sturgeon kebab and dovgha; group C holds dushbara and pakhlava. In this example ABC by margin gives the same groups, but on a real menu they often differ.
Step 2: the popularity threshold
In the Kasavana and Smith method, a dish is popular if its share of sales is at least 70% of the "average share". With 12 dishes the average share is 100% ÷ 12 = 8.33%, so the threshold is 8.33% × 0.7 = 5.83%. Out of our 4,930 portions that is about 288 portions. Anything selling more counts as popular.
Step 3: the average margin
The average margin is weighted by sales, not a simple average: total margin ÷ total portions = 32,452 ÷ 4,930 = 6.58 ₼. A dish with a higher margin per portion counts as profitable.
Step 4: the matrix
| Group | Dishes | What it says |
|---|---|---|
| Stars | plov, lula kebab, tika kebab, tea set, chicken kebab | sell a lot and earn well |
| Plowhorses | dolma, herb qutab, meat qutab | sell a lot, but leave little per portion |
| Puzzle | sturgeon kebab | each portion earns a lot, but few people order it |
| Dogs | dovgha, dushbara, pakhlava | sell little and earn little |
Two results stand out. Tika kebab has a 42.7% food cost; the "cost × 3" rule would flag it as a problem. Yet each portion leaves 8.60 ₼, and it is a star. Herb qutab has a food cost of just 20%, but leaves 3.60 ₼ per portion, so it is a plowhorse. A low percentage, and little money too.
Chicken kebab sits on the line: a 6.1% share of sales and a 6.90 ₼ margin. Watch borderline dishes for a few months rather than deciding on one month's numbers.
DISHMENT
Want to see this in your restaurant?
We'll show you Dishment on your own menu in 30 minutes.
Free demo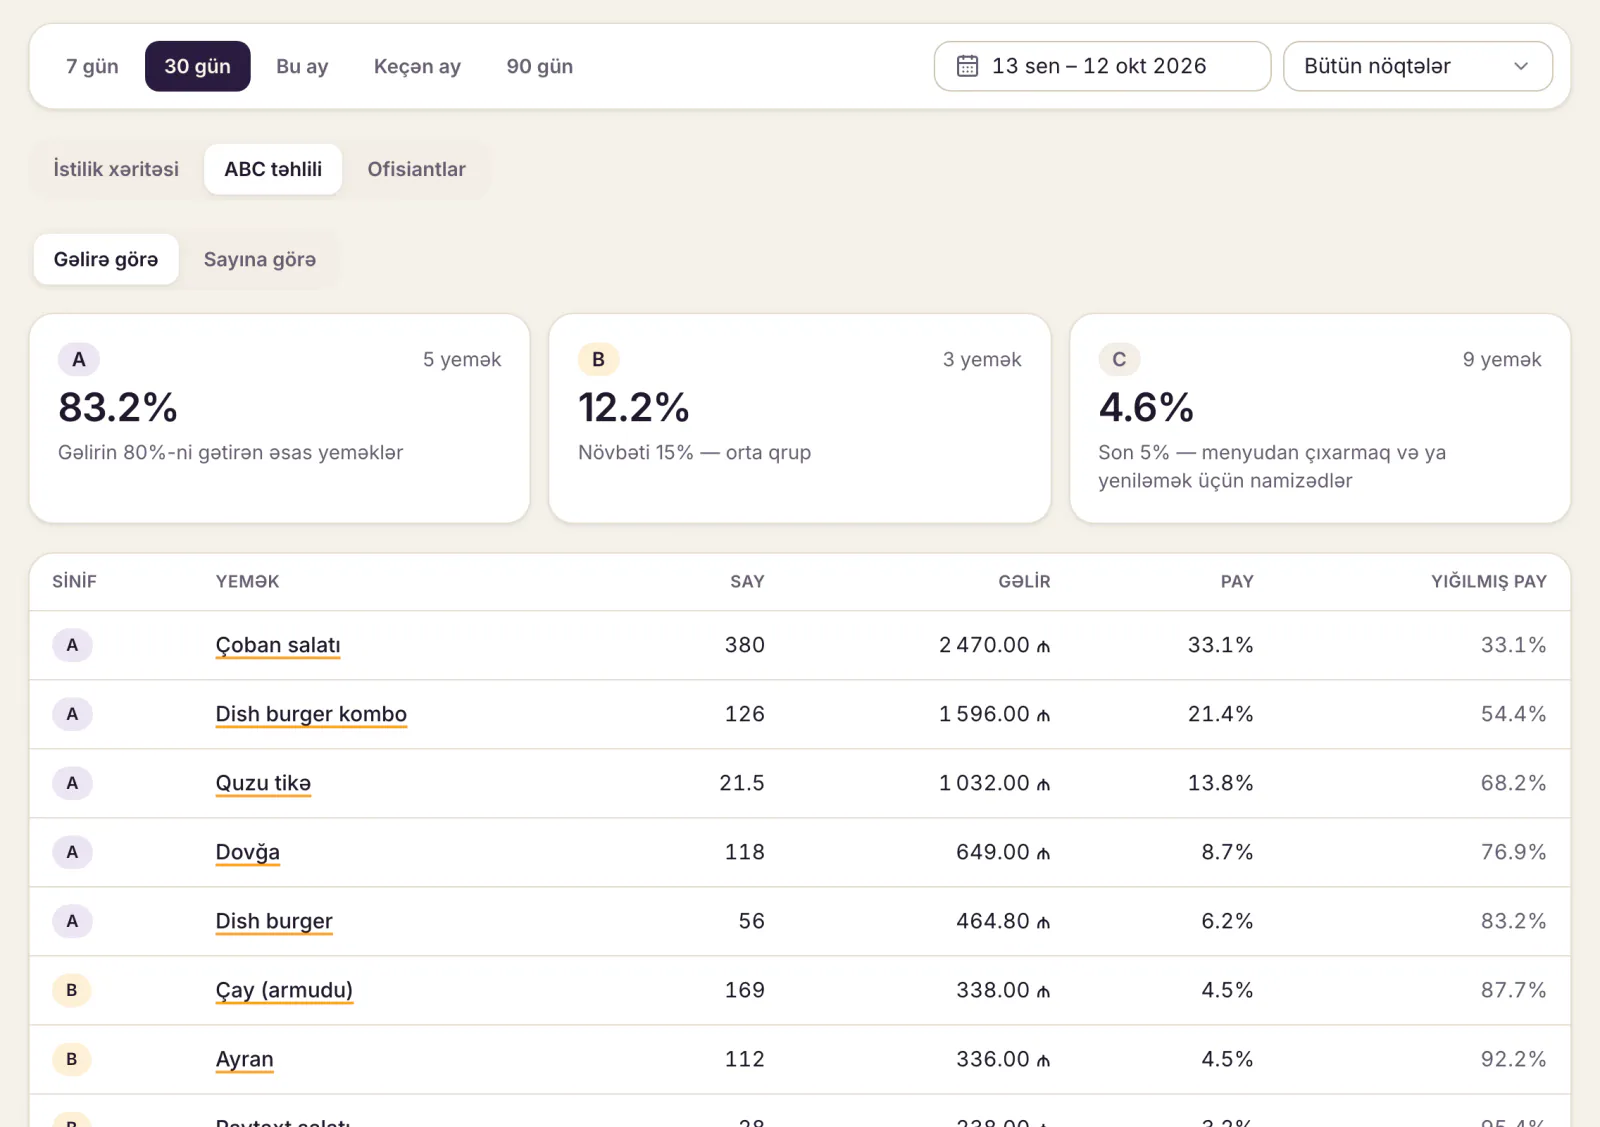
What to do with each group: price, position, portion, removal
Stars: protect them
Keep quality and portion size steady and give them the most visible spot on the menu. You can raise the price, carefully and in small steps. Changing a star's recipe "to save money" is the most expensive mistake.
Plowhorses: lift the margin
Guests already love these dishes; the question is the money per portion:
- Nudge the price up. If dolma goes from 9.00 ₼ to 9.50 ₼ and sales hold, that is 520 × 0.50 = 260 ₼ more margin a month. Herb qutab from 4.50 ₼ to 4.80 ₼ adds 900 × 0.30 = 270 ₼.
- Build a set. "3 herb qutabs + ayran" tops up the qutab's thin margin with a drink.
- Check the cost. Meat qutab runs at a 35% food cost. Check the weight of the filling on the recipe card. Cutting the portion cost by 0.30 ₼ keeps 450 × 0.30 = 135 ₼ a month.
Puzzles: make them visible
Sturgeon kebab earns 14.50 ₼ a portion but is ordered only 90 times a month. Move it to the top of the "Kebabs" section, add a good photo to the QR menu and let waiters taste it so they recommend it with conviction. Thirty more portions a month is 30 × 14.50 = 435 ₼.
Dogs: remove, rework or justify
- Dushbara: rather than a year-round slot, make it a winter weekend special, or drop it.
- Dovgha: close to the popularity line and cheap to make. It is a seasonal dish and may sell more in summer, so judge it by season.
- Pakhlava: weak on its own but a natural partner for tea. A "tea set + pakhlava" offer puts it next to a star.
Sometimes a dog is part of the concept: a kids' dish, a vegetarian option, a regular's favourite. Keeping it is fine, as a deliberate choice.
Together, the price, portion and positioning changes in this example could add about 1,100 ₼ of margin a month (260 + 270 + 135 + 435), provided sales volumes hold. That is a worked example, not a promise: next month's numbers will show the real effect.
Menu design: placement, descriptions, three languages
The matrix says what to do; menu design helps the guest see it:
- The top of each section. Put stars and puzzles where the guest looks first, and dogs at the end of the section.
- Short, appetising descriptions. Not "Sturgeon kebab" but "Sturgeon kebab over charcoal with pomegranate sauce". A description sells a puzzle.
- Fewer, clearer choices. A very long list slows down the choice. Dropping dogs also makes the menu easier to read.
- Don't line prices up in a column. A price column invites the eye to hunt for the cheapest number rather than the dish. Put the price at the end of the description instead.
- Three languages. In Baku some guests read Azerbaijani, others Russian or English. A tourist who doesn't know what dovgha is won't order it; one line of explanation is enough.
- Photos. Good photos of stars and puzzles, especially in the QR menu, make ordering easier.
How often to repeat the analysis
- Monthly: a 10-minute look at ABC. If group A has changed, find out why.
- Quarterly: the full matrix, with at least 4 weeks of data and banquets and one-off orders taken out.
- When supplier prices change: food cost moves, so margins move. When meat gets dearer, kebabs can slide from stars to plowhorses.
- Before and after a seasonal menu: when you add an autumn menu (pomegranate, chestnuts, pumpkin), new dishes "steal" sales from old ones. Look at them together, not one by one.
Don't change everything at once. Make one or two decisions, wait a month and check the result. Otherwise you won't know which change worked.
QR menu statistics: what guests look at and can't find
The till shows what sold; a QR menu shows what guests were interested in. Two useful signals:
- Viewed often, ordered rarely. Guests look at a puzzle but don't order it. Perhaps the price puts them off, the description is unclear or the photo is weak.
- Searched for, but not on the menu. If guests search the QR menu for "kata" or "aubergine", that is a ready-made idea for a new dish.
More on QR menus in our QR menu guide.
Common mistakes
- Looking only at food cost %. The tika kebab example shows that a high percentage doesn't make a dish bad.
- Mixing categories. Our example keeps everything in one list so the maths stays simple. In a real analysis, compare mains, starters, desserts and drinks separately: pitting the tea set against plov isn't always fair.
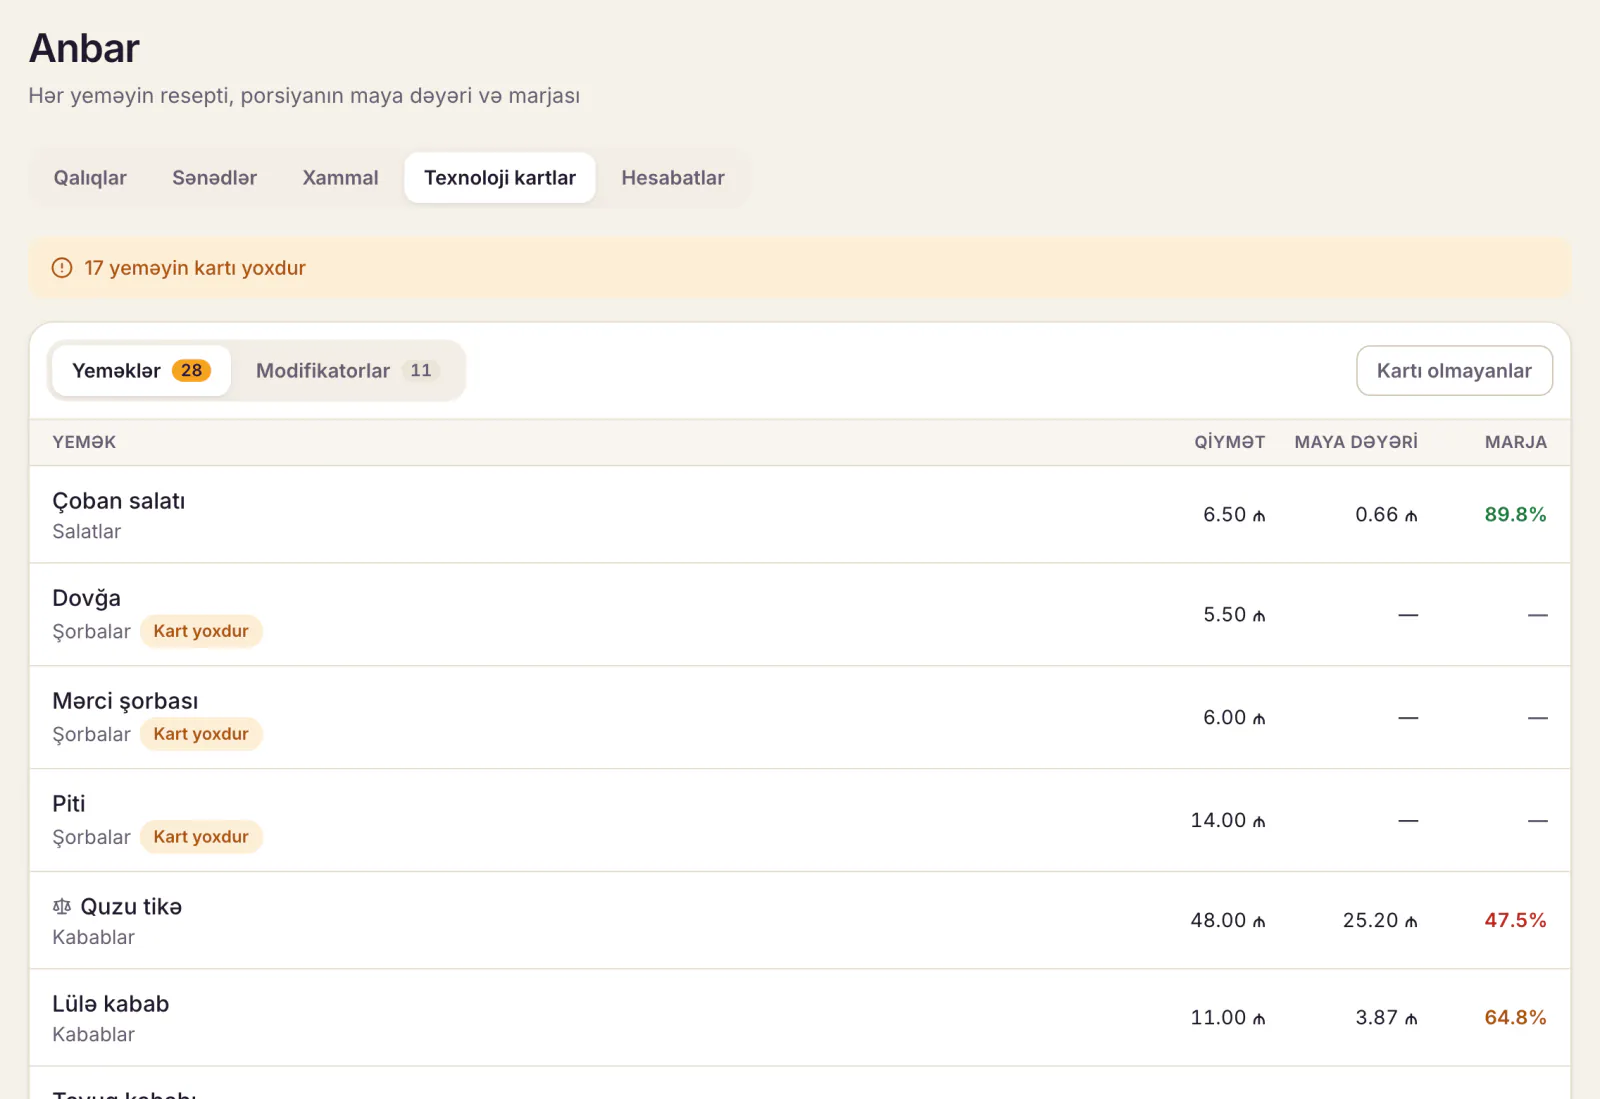
- Dishes without a recipe card. If the cost is unknown, the margin looks inflated. Write recipe cards for your best sellers first.
- Too short a period. One week, especially a holiday week, misleads.
- Dropping dogs automatically. Ask first: who is this dish for, and does it support other sales?
ABC and margins in Dishment
In Dishment you don't have to gather these numbers by hand. In the Advanced reports module, ABC analysis sorts dishes into groups A, B and C by revenue or by quantity (80%, 15% and 5%), and each dish's card shows its group and the change against the previous period. The cost of goods sold report in Inventory and recipes shows, for every dish, the quantity sold, revenue, cost, gross profit and margin %, and exports to CSV. Both numbers the matrix needs, popularity and margin per portion, are right there: open the file in Excel and repeat the steps above. Dishes without a recipe card are listed separately, so the margin isn't overstated.
The anonymous statistics in the QR menu module show which dishes guests look at and what they search for but can't find. And for raising the average check, see our separate guide.
FAQ
What is ABC analysis of a menu, in simple terms?
Sorting dishes by revenue (or margin) and splitting them into three groups: A brings in 80% of revenue, B the next 15% and C the remaining 5%. It shows where to focus on the menu.
How much data do I need for menu engineering?
At least 4 weeks of sales and the cost of each dish from its recipe card. Treat holidays and banquets separately.
How often should I run a menu engineering analysis?
ABC monthly, the full matrix quarterly and whenever supplier prices change. Repeat it when the seasonal menu changes too.
Can I analyse drinks together with food?
You can, but the result may mislead. Separate matrices for drinks, desserts and mains are more accurate.
How do I do ABC analysis in Excel?
Sort dishes by revenue in descending order, work out each dish's share, add up the shares and split the groups at 80% and 95%. Dishment does this calculation for you.
DISHMENT
Try it free for 30 days
We open the account and move your menu over together. No card needed.
30 days free