Finance· 12 min read· Dishment team
Food cost calculator: a free Excel template with formulas
A ready-made food cost calculator for Excel or Google Sheets: sheets for ingredient prices, the dish card, the menu and weekly food cost, formulas to copy and a worked lula kebab example.
Free Excel templateFood cost calculatorThe article’s tables and formulas, ready to use — opens in Excel and Google Sheets.Download (.xlsx)Working out food cost once on paper is easy. The hard part is redoing it every week and after every price change. That's what a simple food cost calculator is for: you change an ingredient's price in one place, and the cost and food cost percentage of every dish update by themselves.
This article gives you a ready-made food cost calculator template for Excel or Google Sheets: four sheets, what each column means and formulas you can copy. The examples use lula kebab and lentil soup. All prices are illustrative, so plug in your own suppliers' figures. We explained what food cost is and what percentage counts as normal in a separate article: food cost calculation.
What a food cost calculator works out
The calculator answers two questions:
- What does one portion cost, and what is its food cost percentage? Food cost % = portion cost ÷ selling price × 100.
- How much stock did the kitchen actually use this week? Food cost % = (opening stock + purchases − closing stock) ÷ kitchen sales × 100.
The first number is "what it should be", the second "what it was". The gap between them is loss: over-portioning, spoiled stock, write-offs nobody recorded. A good template shows both side by side.
How the template is built: four sheets
| Sheet | What it's for | How often to update |
|---|---|---|
| Ingredients | Purchase price and standard loss % for every ingredient | With every supplier invoice |
| Card | Costing one dish: gross, loss, net, cost, food cost | When the recipe changes |
| Menu | Cost, price, percentage and margin of every dish | Weekly |
| Week | Actual food cost: stock, purchases, sales | Weekly, after the stock count |
Copy the tables below into your own file. The formulas refer to the column letters, so keep them as they are.
Sheet 1: Ingredients (the price list)
Each ingredient goes in once, on one row. The dish cards take prices from here, so when a price changes you update only this sheet.
| A: Code | B: Ingredient | C: Unit | D: Purchase price, ₼ | E: Standard loss | F: Supplier | G: Price date |
|---|---|---|---|---|---|---|
| M01 | Minced lamb | kg | 16.00 | 0% | ||
| M02 | Onion | kg | 1.20 | 15% | ||
| M03 | Lavash | each | 0.30 | 0% | ||
| M04 | Tomatoes and peppers | kg | 3.00 | 10% | ||
| M05 | Herbs and sumac | kg | 8.00 | 20% | ||
| M06 | Salt, pepper | kg | 2.00 | 0% | ||
| M07 | Red lentils | kg | 3.50 | 0% | ||
| M08 | Carrot | kg | 1.00 | 20% | ||
| M09 | Butter | kg | 14.00 | 0% | ||
| M10 | Lemon | kg | 4.00 | 0% | ||
| M11 | Flour and spices | set | 0.30 | 0% |
Two rules: always use the same unit (if you buy herbs by the bunch, weigh one bunch once and convert to a price per kilo), and record every price on the sheet the same way, either with VAT or without.
Sheet 2: Card (costing one dish)
Dish settings at the top, ingredients below. Example: lula kebab, one portion.
| Cell | What it is | Example |
|---|---|---|
| B1 | Dish | Lula kebab |
| B2 | Yield (number of portions) | 1 |
| B3 | Menu price, ₼ | 14.00 |
| B4 | Price includes VAT? (Yes / No) | No |
| B5 | Target food cost | 32% |
Ingredients start on row 8:
| A: Code | B: Ingredient | D: Gross | E: Loss | F: Net | G: Price, ₼ | H: Cost, ₼ |
|---|---|---|---|---|---|---|
| M01 | Minced lamb | 0.250 kg | 0% | 0.250 kg | 16.00 | 4.00 |
| M02 | Onion | 0.060 kg | 15% | 0.051 kg | 1.20 | 0.07 |
| M03 | Lavash | 1 | 0% | 1 | 0.30 | 0.30 |
| M04 | Tomatoes and peppers | 0.150 kg | 10% | 0.135 kg | 3.00 | 0.45 |
| M05 | Herbs and sumac | 0.030 kg | 20% | 0.024 kg | 8.00 | 0.24 |
| M06 | Salt, pepper | 0.005 kg | 0% | 0.005 kg | 2.00 | 0.01 |
| Total | 5.07 |
Result: the portion costs 5.07 ₼, food cost is 5.07 ÷ 14.00 = 36.2%, and the margin per portion is 8.93 ₼. With a 32% target, the suggested price is 5.07 ÷ 0.32 = 15.85 ₼, or 15.90 ₼ rounded. Raising the price isn't the only lever: check the portion size and the supplier too.
Note that cost is calculated from the gross weight, because that's what you pay for. The net column is for the kitchen, so the cook knows what goes on the plate.
Formulas for the Card sheet
Enter these on row 8 and fill down:
- B8 (ingredient name):
=XLOOKUP(A8,Ingredients!A:A,Ingredients!B:B,"") - E8 (loss, can be overwritten):
=XLOOKUP(A8,Ingredients!A:A,Ingredients!E:E,0) - F8 (net):
=D8*(1-E8) - G8 (price):
=XLOOKUP(A8,Ingredients!A:A,Ingredients!D:D,0) - H8 (cost):
=D8*G8
Totals (for example on rows 20–26):
- Batch cost:
=SUM(H8:H19) - Portion cost:
=SUM(H8:H19)/B2 - Price excluding VAT:
=IF(B4="Yes",B3/1.18,B3) - Food cost %: portion cost ÷ price excluding VAT, formatted as a percentage
- Margin, ₼: price excluding VAT − portion cost
- Suggested price:
=CEILING(portion_cost/B5,0.1); if you are VAT-registered, multiply the result by 1.18.
If your version of Excel doesn't have XLOOKUP, use VLOOKUP instead: =VLOOKUP(A8,Ingredients!A:G,4,FALSE). Depending on your regional settings, Excel may expect semicolons instead of commas between arguments.
Dishes cooked in batches: lentil soup
Soup, plov and sauces aren't cooked one portion at a time. For these, put the number of portions the batch yields in B2. Example: one pot, 10 portions.
| Ingredient | Gross | Price, ₼ | Cost, ₼ |
|---|---|---|---|
| Red lentils | 1.000 kg | 3.50 | 3.50 |
| Onion | 0.300 kg | 1.20 | 0.36 |
| Carrot | 0.200 kg | 1.00 | 0.20 |
| Butter | 0.100 kg | 14.00 | 1.40 |
| Lemon (to serve) | 0.200 kg | 4.00 | 0.80 |
| Flour and spices | 1 set | 0.30 | 0.30 |
| Total, 10 portions | 6.56 |
A portion costs 6.56 ÷ 10 = 0.656 ₼, or 0.66 ₼ rounded. At 4.50 ₼ the food cost is 14.6% and the margin 3.84 ₼. Soup is cheap and pulls the menu's average percentage down, while the kebab pushes it up. That's why you track food cost across the whole menu as well as dish by dish.
Sheet 3: Menu (every dish in one place)
One row per dish. Column B links to the dish's card sheet (for example =Card!H21), and column F is the weekly number sold from your till report.
| A: Dish | B: Cost, ₼ | C: Price, ₼ | D: Food cost | E: Margin, ₼ | F: Sold | G: Total margin, ₼ | H: Status |
|---|---|---|---|---|---|---|---|
| Lula kebab | 5.07 | 14.00 | 36.2% | 8.93 | 180 | 1,607.04 | Check |
| Lentil soup | 0.66 | 4.50 | 14.6% | 3.84 | 140 | 538.16 | OK |
| Plov | 4.30 | 14.00 | 30.7% | 9.70 | 120 | 1,164.00 | OK |
| Herb qutab | 1.46 | 5.00 | 29.2% | 3.54 | 150 | 531.00 | OK |
| Tea set | 2.40 | 12.00 | 20.0% | 9.60 | 90 | 864.00 | OK |
Formulas: D = =B2/C2, E = =C2-B2, G = =E2*F2, H = =IF(D2>Target,"Check","OK"). Keep the target in its own cell, for example 32%, and use conditional formatting to colour the rows above it.
Theoretical food cost for these five dishes: =SUMPRODUCT(B2:B6,F2:F6)/SUMPRODUCT(C2:C6,F2:F6) = 1,956 ÷ 6,660 = 29.4%.
The table shows something worth noticing: the kebab has the highest percentage, but it also brings in the most margin each week. Dropping it from the menu because of the percentage alone would be a mistake. To judge sales and margin together, see restaurant menu engineering.
Sheet 4: Weekly food cost (actual vs theoretical)
This sheet compares "what it should be" with "what it was". Stock figures come from the stock count, purchases from invoices, sales from the till report.
| A: Week | B: Opening stock, ₼ | C: Purchases, ₼ | D: Closing stock, ₼ | E: Used, ₼ | F: Kitchen sales, ₼ | G: Actual food cost | H: Theoretical food cost | I: Gap, pts | J: Gap, ₼ |
|---|---|---|---|---|---|---|---|---|---|
| 1 | 2,800 | 6,100 | 2,600 | 6,300 | 19,500 | 32.3% | 29.8% | 2.5 | 489 |
| 2 | |||||||||
| 3 | |||||||||
| 4 |
Formulas: E = =B2+C2-D2, G = =E2/F2, I = =(G2-H2)*100, J = =E2-H2*F2. Next week's opening stock is this week's closing stock: B3 = =D2.
In the example, the recipe cards say the kitchen should have used 5,811 ₼ of stock; it actually used 6,300 ₼. That 489 ₼ gap in one week is about 2,000 ₼ a month. If the gap is more than a point, look for the reason: portion sizes, unrecorded write-offs, a loss % missing from a card, or theft. On recording write-offs properly: restaurant food write-off log. On counting stock: restaurant inventory count.
DISHMENT
Want to see this in your restaurant?
We'll show you Dishment on your own menu in 30 minutes.
Free demoUsing it in Google Sheets
The same formulas work in Google Sheets, XLOOKUP included. The upside: the manager and the chef can open the file at the same time, version history is kept and you can check it from a phone. One rule: only one person edits the Ingredients sheet, everyone else gets view-only access. Otherwise someone deletes a price by accident and every card shows zero.
Common mistakes
- Costing from net weight. The card looks cheap and the stockroom comes up short.
- Not updating prices. The supplier has raised the price of meat, and the Ingredients sheet still shows the old one.
- Forgetting what goes on the side. Lavash, lemon, sauce and yoghurt are part of the portion cost.
- Watching the percentage and forgetting the margin. A cheap dish with a low percentage can earn less than an expensive one with a high percentage.
- Never measuring actual food cost. The cards only say what it should be. Without the Week sheet you won't see your losses.
Where Excel runs out
A food cost calculator in Excel works comfortably up to about 20–30 dishes. After that the friction starts: copying prices from every invoice by hand, typing in weekly sales from the till report, linking prep items from card to card. Excel also doesn't deduct stock as dishes sell, so you still count what's on the shelf by hand.
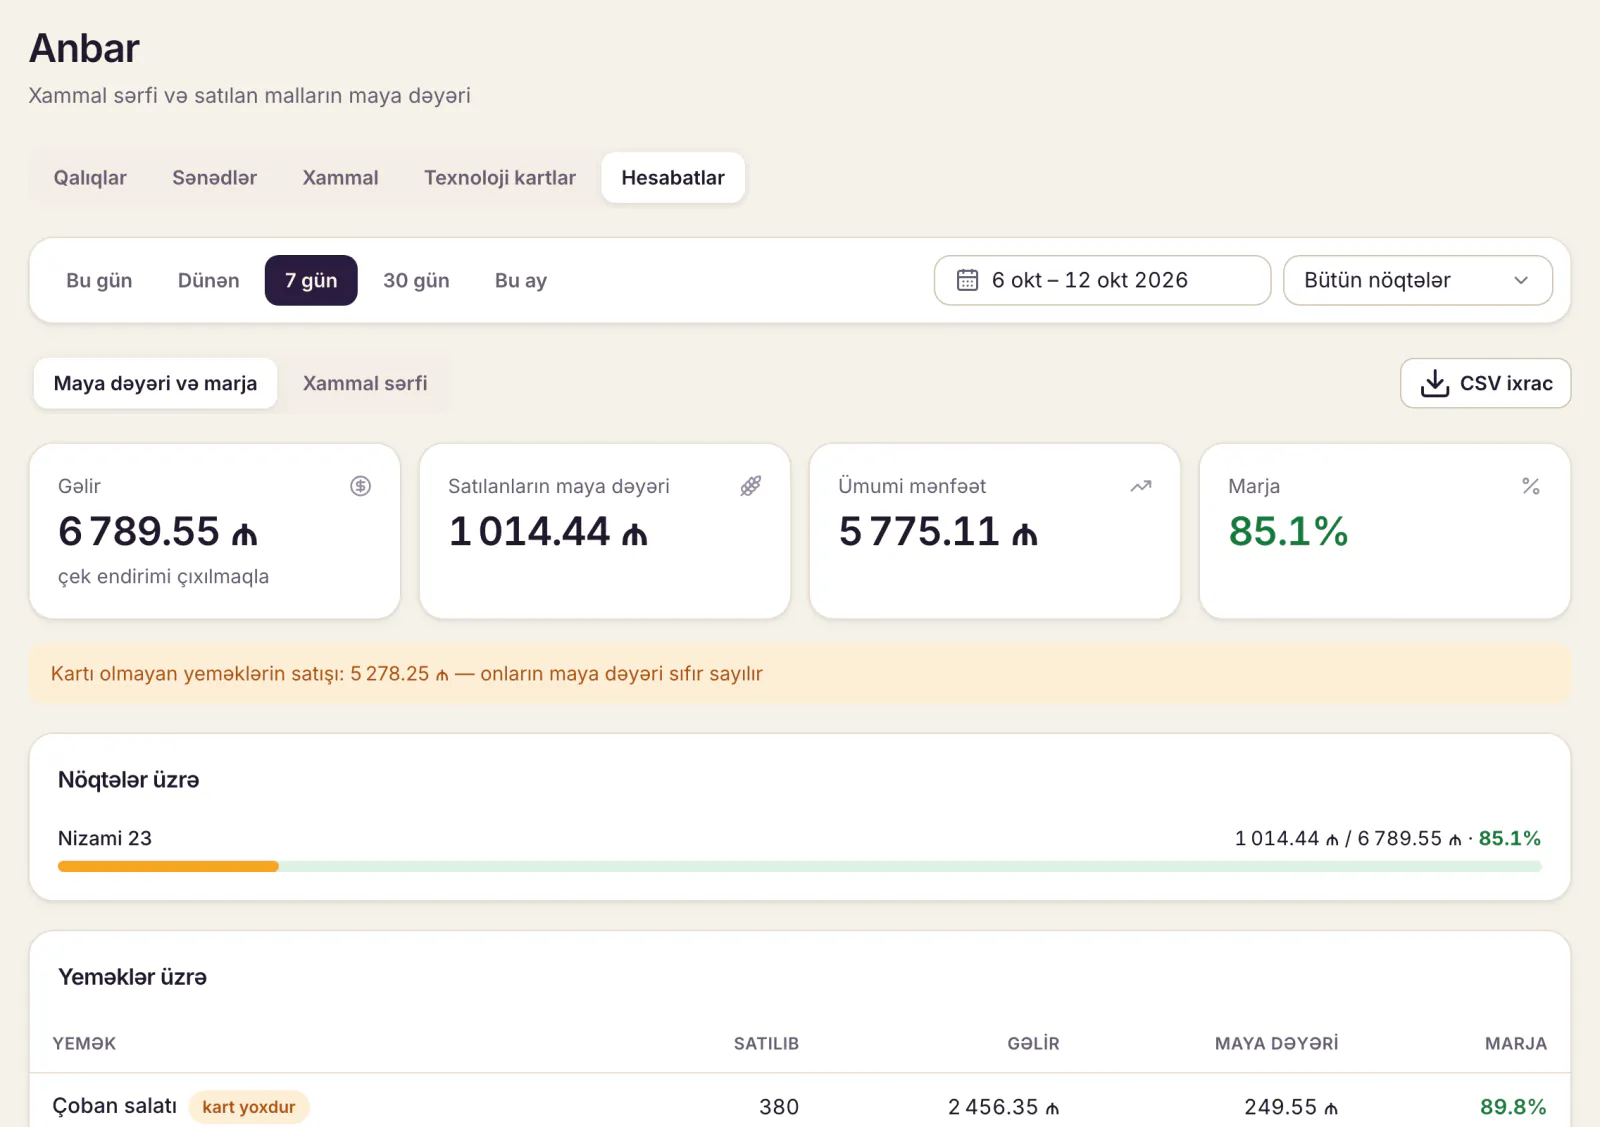
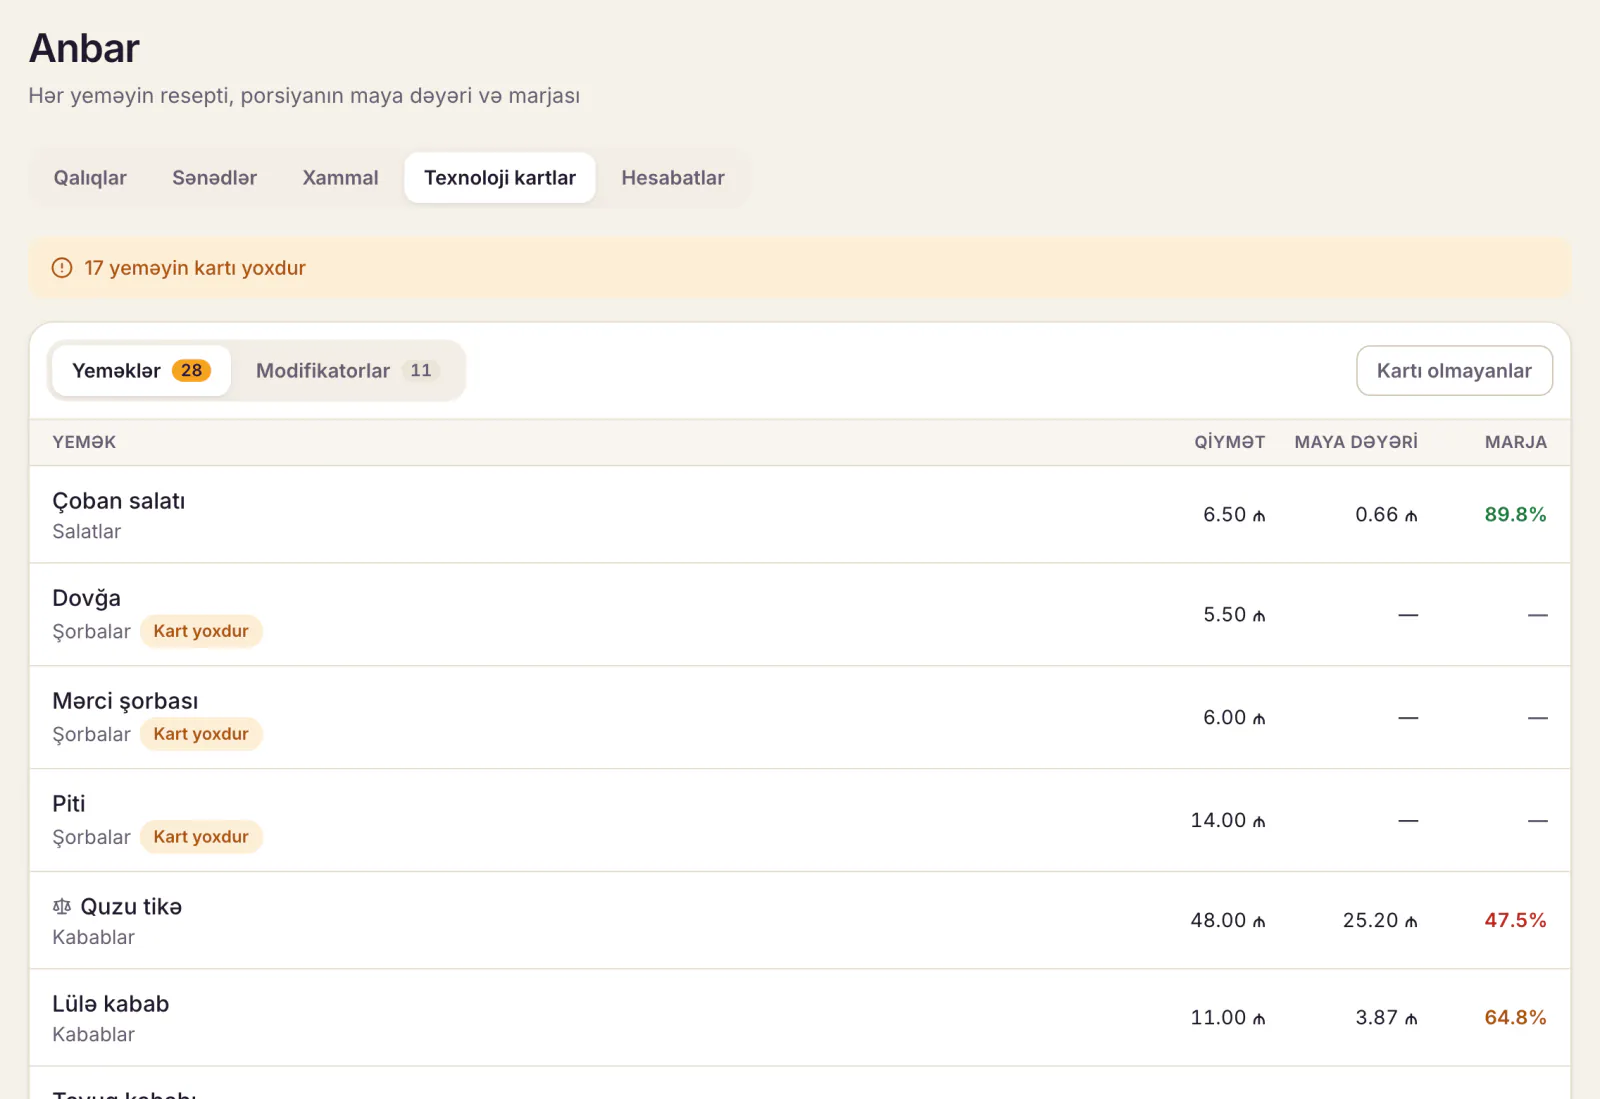
In Dishment's Inventory and recipes module this happens on its own. Recipe cards are written with gross, loss % and net, every dish sold deducts its ingredients automatically, and cost and margin are calculated at the average purchase price. Dishes without a card show up in a separate list. The stock count puts book and actual stock side by side and shows the value of the difference in manat, which is the Week sheet's job done for you. We showed how to write a recipe card in a separate article: restaurant recipe card template. For the full profit picture: restaurant profit margin.
If your sheet is already filled in, the work isn’t lost: in Dishment the ingredient list, tech cards and opening stock load from that same file with «Import from Excel» in Back Office. The columns are recognised for you, and rows with errors show up before anything is saved.
FAQ
What is a food cost calculator?
A spreadsheet or program that takes a dish's ingredients and their prices and works out the portion cost and the food cost percentage. A good one also suggests a selling price and shows your actual weekly food cost.
How do I get the Excel template?
Copy the four tables from this article into Excel or Google Sheets, keep the column letters and enter the formulas in the cells shown. Replace the example figures with your own prices.
What should my food cost percentage be?
It depends on the format: often 25–35% for fast food and cafes, lower for drinks. Treat it as a benchmark, not a rule: track your own numbers for a few weeks and set your own target.
Should food cost use the price with or without VAT?
Without VAT, if you are VAT-registered. Otherwise the percentage looks lower than it really is. Cell B4 in the template handles this automatically.
When is Excel no longer enough?
When the menu passes 30 dishes, prep items multiply and you want stock levels to follow sales automatically. At that point restaurant software with inventory and recipe cards saves both time and money.
DISHMENT
Try it free for 30 days
We open the account and move your menu over together. No card needed.
30 days free