Finance· 9 min read· Dishment team
Restaurant Profit and Loss Statement: a Monthly P&L Example for a Baku Café
The lines of a restaurant P&L, a monthly example for a 40-seat café in Baku in manat, income and expense categories, an Excel template and why profit isn't cash.
Free Excel templateProfit and loss statementThe article’s tables and formulas, ready to use — opens in Excel and Google Sheets.Download (.xlsx)The till looks healthy every evening, yet at the end of the month there is next to nothing in the bank. The first time an owner sees this, they usually suspect somebody. More often the reason is simpler: income and costs were never brought together for the month, so nobody can see where the profit leaked. A restaurant profit and loss statement shows exactly that: what you sold, what it cost and what was left.
Below are the lines of a restaurant P&L, a monthly example for a 40-seat café in Baku in manat, an Excel template and five questions to read it with.
What an income and expense report is
It is a table that puts all income and all costs for a period, usually a month, side by side. At the bottom there is one number: profit or loss. Hence the other name, profit and loss statement, or P&L. This is a management report for the owner and manager. The official financial statements filed with the state are a separate matter, covered further down.
Profit and loss statement: the lines
| Line | What goes in |
|---|---|
| Revenue | Dine-in, takeaway, delivery, banquets; net of discounts |
| Cost of sales | Food and drink cost of what was sold |
| Gross profit | Revenue − cost of sales |
| Payroll | Gross wages, bonuses, employer contributions |
| Rent | Dining room, storage, parking |
| Utilities | Electricity, gas, water, waste |
| Operating costs | Card fees, marketing, supplies, repairs, internet and software |
| Operating profit | Gross profit − all operating costs |
| Depreciation | Equipment and fit-out spread over years |
| Loan interest | Interest only, not principal |
| Tax | Simplified tax or profit tax |
| Net profit | What's left for the owner |
Two lines go wrong most often. Cost of sales isn't "food bought this month" but the food cost of dishes sold: opening stock + purchases − closing stock. Without a stock count the figure is a guess. And depreciation gets forgotten entirely: a 4,500-manat coffee machine is a cost spread over five years, not the month you bought it.
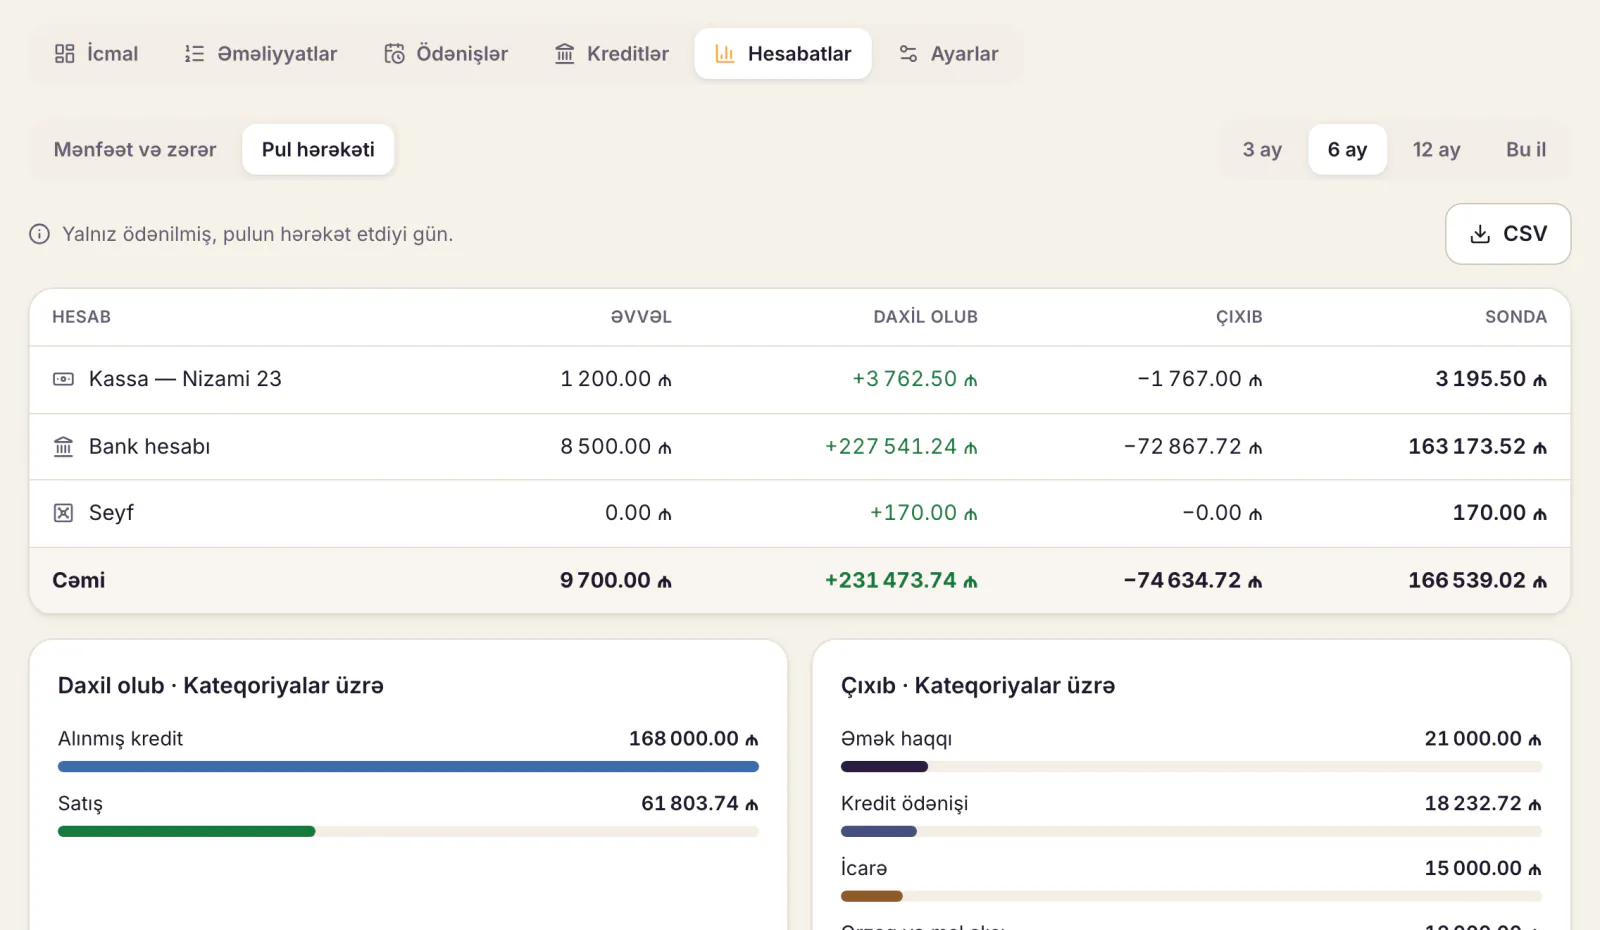
Example: monthly P&L for a 40-seat café in Baku
Example: a 40-seat café in Yasamal, 12 staff, about 2,400 checks a month, average check 22 ₼. 60% of payments are by card through a POS terminal integrated with the fiscal register (NKA). The café pays simplified tax at 8%. Figures are illustrative.
| Line | AZN | % of revenue |
|---|---|---|
| Revenue | 52,800.00 | 100.0 |
| Cost of sales (food and drink) | 16,900.00 | 32.0 |
| Gross profit | 35,900.00 | 68.0 |
| Payroll incl. employer contributions | 11,450.00 | 21.7 |
| Rent | 6,000.00 | 11.4 |
| Utilities | 2,300.00 | 4.4 |
| Marketing | 900.00 | 1.7 |
| Supplies | 600.00 | 1.1 |
| Card fees | 520.00 | 1.0 |
| Repairs and small equipment | 450.00 | 0.9 |
| Internet, phone, software | 350.00 | 0.7 |
| Operating profit | 13,330.00 | 25.2 |
| Depreciation (60,000 ₼ equipment and fit-out, 5 years) | 1,000.00 | 1.9 |
| Loan interest | 300.00 | 0.6 |
| Profit before tax | 12,030.00 | 22.8 |
| Simplified tax | 3,590.40 | 6.8 |
| Net profit | 8,439.60 | 16.0 |
The tax line reflects a real 2026 change. From 1 January, for three years, catering businesses paying 8% simplified tax pay 6% on cashless payments from the public taken through a POS terminal integrated with the NKA, with 8% on the rest of turnover (State Tax Service "Simplified tax" booklet, 2026). Here: 31,680 × 6% + 21,120 × 8% = 1,900.80 + 1,689.60 = 3,590.40 ₼, against 4,224 ₼ if everything were taxed at 8%, a difference of 633.60 ₼ a month. More on regimes and conditions in restaurant taxes in Azerbaijan 2026; confirm your own regime with your accountant.
A 16% net margin is a good month, but months differ. During Ramadan iftar lifts evening revenue while lunchtime empties; in summer many people leave the city. Base decisions on at least a three-month trend, not one report.
Tracking income and expenses: categories
| Category | Examples | Commonly cited range |
|---|---|---|
| Food cost | Meat, rice, herbs, tea, drinks | Depends on the menu, often 25–35% |
| Payroll | Wages, bonuses, contributions | 20–30% of revenue |
| Rent | Dining room, storage | Ideally around 10% |
| Utilities | Power, gas, water | Depends on the kitchen |
| Marketing | Instagram ads, print, promotions | A planned monthly amount |
| Operating | Card fees, supplies, repairs, software | Small, but they add up |
These ranges are reference points often quoted in the trade, not rules. A coffee shop has a lower food cost than a kebab house. Build your own numbers and compare yourself with yourself. How to calculate food cost is in food cost calculation, and payroll in restaurant payroll in Azerbaijan.
Profit and loss template in Excel
Two sheets work best. On "Transactions", each row is one income or cost: date, category, description, amount, payment method, venue. Enter daily revenue as one line from the Z reports, not check by check. Cash expenses come from the cash book.
On "P&L", rows are the lines above and columns are months. A category's monthly total: =SUMIFS(Transactions!D:D,Transactions!B:B,$A3,Transactions!A:A,">="&B$1,Transactions!A:A,"<="&EOMONTH(B$1,0)), where A3 holds the category name (for example Revenue) and B1 is the first day of the month; gross profit =B3-B4; share of revenue =B5/B$3. With months side by side the trend shows itself: rent stays flat, food cost jumps in the month meat got dearer.
How to read the report: 5 questions
- Revenue went up; did profit? If revenue is up 10% and net profit hasn't moved, discounts grew or extra staff came with the extra sales.
- How many points did food cost move? Two points on 52,800 ₼ of revenue is over 1,000 manat a month. The cause is usually prices, write-offs or portions.
- Does payroll move with revenue? If the same headcount works through quiet months, the payroll share climbs. That's a scheduling question.
- What's hiding in "other"? If "other" is above 3% of revenue, a whole category is hiding there.
- Does net profit match the money in the bank? It won't, and here's why.
How profitability is calculated and what a café really earns is covered in restaurant profit margin; the other numbers an owner should check weekly are in restaurant management KPIs.
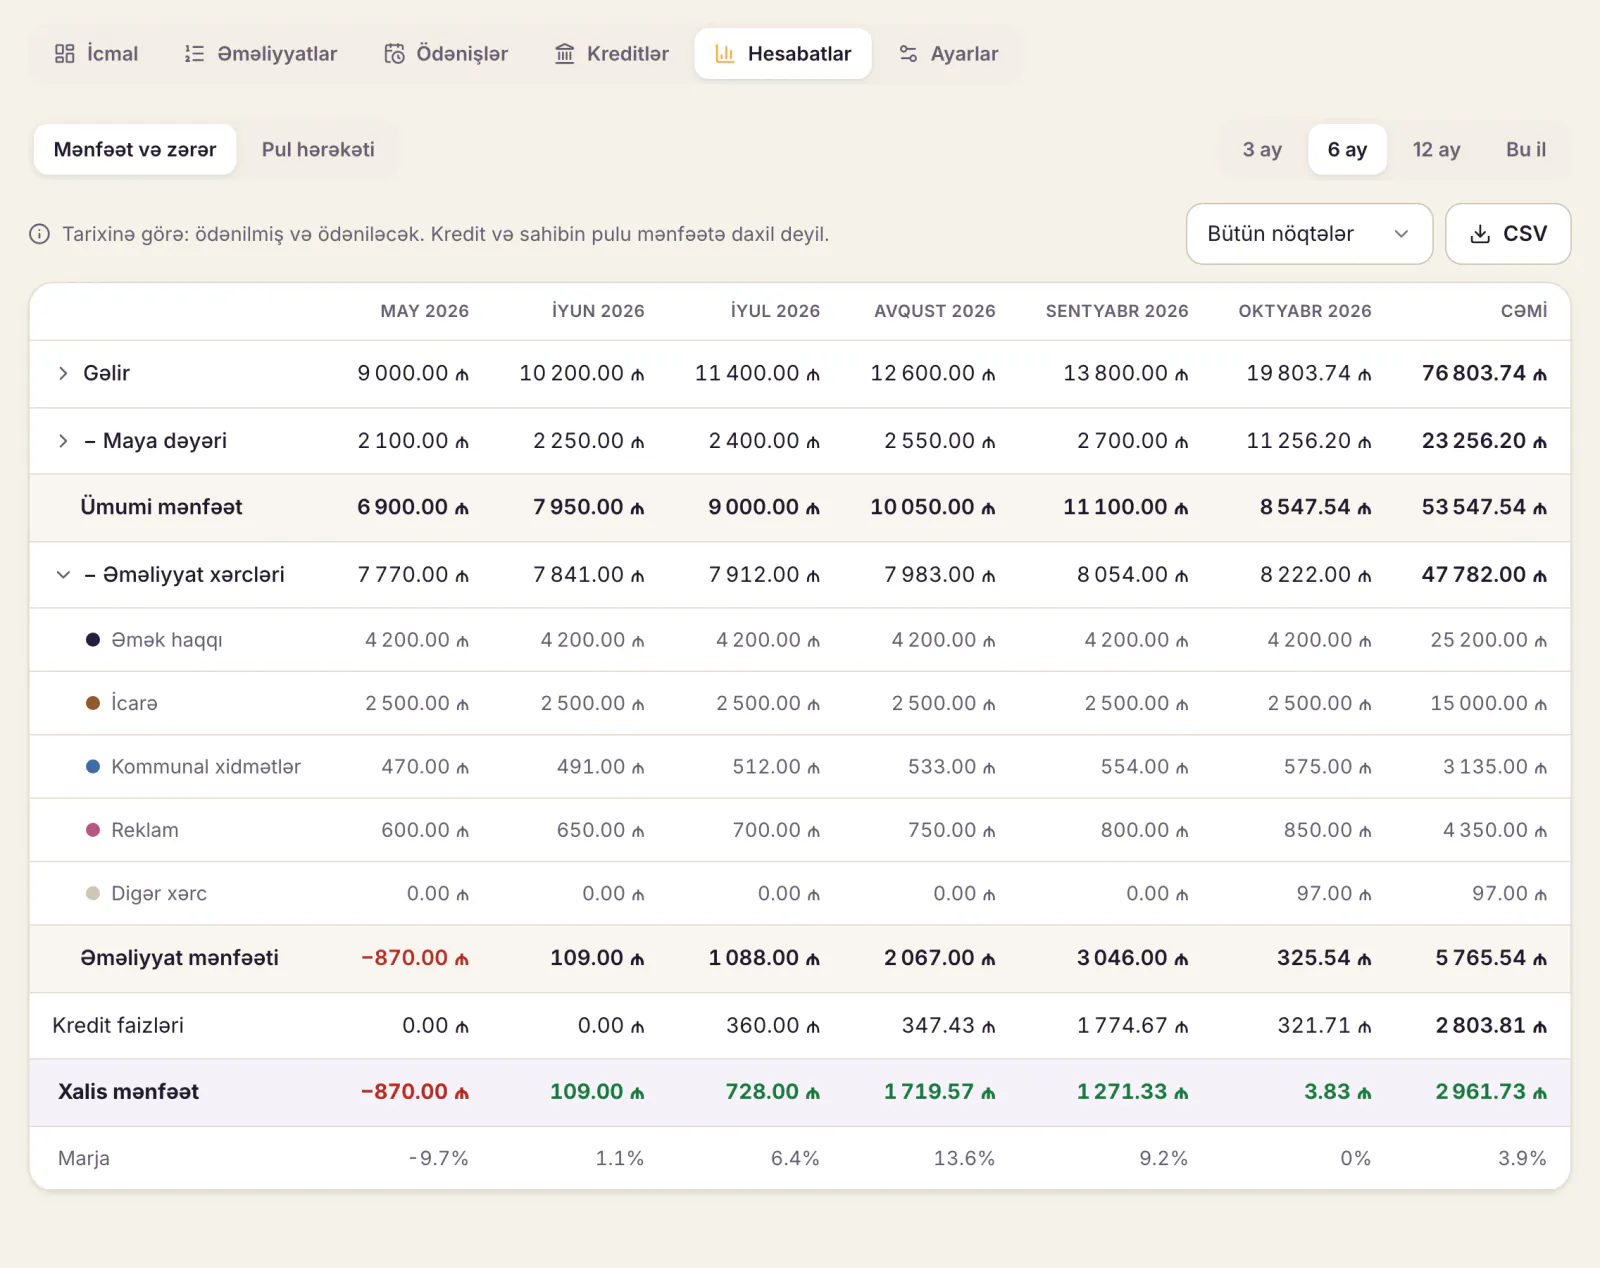
Profit and cash flow are not the same
Same café, same month. The P&L shows 8,439.60 ₼ net profit, but bank and safe together grew by only 3,539.60 ₼:
| Movement | In the P&L | In cash |
|---|---|---|
| Net profit | +8,439.60 | |
| Depreciation (no cash leaves) | +1,000.00 | |
| Loan principal repaid | not shown | −2,000.00 |
| New coffee machine bought | depreciation only | −4,500.00 |
| Supplier debt grew | cost recorded | +1,800.00 |
| Stock grew (rice bought before a price rise) | not a cost yet | −1,200.00 |
| Increase in cash | 3,539.60 |
Both figures are right; they answer different questions. The P&L asks "is the business making money?", cash flow asks "can I pay next month's rent?". A loss-making restaurant can look cash-rich for months by building up supplier debt, and a profitable one can run out of cash in the month it renovates.
Management P&L vs statutory accounts
The "profit and loss statement" your accountant prepares is part of the official financial statements: its format, line items and filing deadlines are set by accounting law and standards. "Statement of comprehensive income" is an international standards term that adds items like asset revaluation on top of ordinary profit. For a small café that's the accountant's job. Your management P&L is yours: you pick the categories, look at it as soon as the month closes, and see each venue separately. How the work splits between accounting software and a restaurant system is covered in restaurant accounting software.
Automatic reporting: income and costs in one place
The hardest part of an Excel P&L is gathering the numbers: Z reports in one place, invoices in another, rent in the owner's phone. Month-end takes two days.
Dishment's Finance module keeps restaurant finance tracking in one place. When the day closes, till takings come in as income on their own. You record expenses with a category, counterparty, venue and receipt photo; rent and utilities recur every month by themselves with a due-date reminder. Loan schedules, interest and the outstanding balance are calculated automatically. Profit and loss and cash movement show by month and venue, with CSV export. With Inventory and Staff and payroll connected, supplier receipts and wages land in "to pay" automatically.
The honest limit: Finance is the owner's management accounting, not a replacement for accounting software; statutory bookkeeping and tax reporting are done separately. Terms are on the pricing page.
DISHMENT
Try it free for 30 days
We open the account and move your menu over together. No card needed.
30 days freeFAQ
How do I calculate income, expenses and profit?
Profit = income − expenses. For a restaurant, step by step: revenue minus cost of sales (gross profit), minus wages, rent, utilities and other costs (operating profit), minus depreciation, interest and tax (net profit).
When should a P&L be prepared?
For management, monthly, in the first week after the month closes. Statutory deadlines are set by law; ask your accountant.
How is a management P&L different from the accountant's?
The management report is for the owner and uses categories you choose. The statutory one follows a set format and standards and is filed with the authorities.
What profit should a café make?
There's no universal figure: format, rent and menu change everything. Keep your own report for three to six months in a row and watch the trend.
Sources
- State Tax Service, "Simplified tax" booklet (2026), 8% and 6% rates for catering: taxes.gov.az