Management· 11 min read· Dishment team
Restaurant management KPIs: 10 numbers every owner should track, with formulas
Ten KPIs for running a restaurant by the numbers: formulas, a worked example for a 60-seat Baku restaurant in AZN, how often to check each one, and a 30-minute weekly meeting agenda.
You can run a restaurant on gut feeling: the dining room is full, so all is well. The trouble is that a full room is not the same as a profit. Restaurant management means the owner looks at the same numbers every week, compares them with the plan and makes a decision in time when something drifts. This article covers the 10 restaurant management KPIs worth tracking, with formulas and worked examples in Azerbaijani manat: what to measure, how often to look, and which problem each number points to.
All figures are examples, not "industry norms". Set your targets from your own restaurant's results over two or three months.
What restaurant management really is: three questions and a rhythm
Running a restaurant comes down to three questions: how much do we sell, how much of that goes on costs, and where does money leak. Each question has its own numbers. Once you define them and calculate them the same way every week, the restaurant stops living in firefighting mode.
You need four things:
- Numbers: 10 KPIs, each with one formula, over the same period.
- Owners: every KPI has a person responsible for it: the manager, the head chef or you.
- Rhythm: a daily, weekly and monthly review.
- One source: the numbers come from one place instead of being copied out of notebooks every time.
The example restaurant
We'll use the same hypothetical restaurant throughout: 60 seats in Baku, open 30 days a month.
| Item | Per month |
|---|---|
| Revenue | 90,000 ₼ |
| Covers (guests) | 4,500 (150 a day) |
| Food and drink cost | 28,800 ₼ |
| Payroll (including employer's social contributions) | 22,500 ₼ |
| Rent, utilities, loan interest and other fixed costs | 17,100 ₼ |
The 10 KPIs: formulas and examples
1. Revenue against plan
Plan achievement, % = actual revenue ÷ planned revenue × 100
If the plan was 95,000 ₼: 90,000 ÷ 95,000 × 100 = 94.7%. Track revenue daily and compare it with the same day last week; comparing a Thursday with a Monday tells you nothing. If only 40% of the plan is in by the 15th, you see the problem while there is still time to act.
2. Covers and seat turnover
Seat turnover = covers per day ÷ number of seats
150 ÷ 60 = 2.5: each seat is filled two and a half times a day on average. When revenue falls, the first question is whether you have fewer guests or a lower check. They are different problems with different fixes. Look at turnover by hour and the dead hours show up: if lunch is full and 4 to 6 pm is half empty, that is where your offer needs to go.
3. Average check
Average check per guest = revenue ÷ covers
90,000 ÷ 4,500 = 20 ₼. The average check per bill is easily distorted by split bills, so for a table-service restaurant the per-guest figure is more honest. In this example, 1 ₼ more per guest is worth 4,500 ₼ a month. We collected ten ways to raise it in our article on how to increase the average check.
4. Food cost percentage
Food cost, % = cost of food and drink sold ÷ revenue × 100
28,800 ÷ 90,000 × 100 = 32%. Calculate the cost of goods sold either from your recipe cards or as "opening stock + purchases − closing stock". What you bought this month is not your food cost: anything still on the shelf is not this month's expense. The per-dish method is in our food cost guide.
5. Labour cost percentage
Labour cost, % = payroll ÷ revenue × 100
22,500 ÷ 90,000 × 100 = 25%. Track this as a percentage rather than in manat: payroll rising a little as revenue grows is normal, its share rising is not. Payroll here means gross pay plus the social contributions the employer pays, not the take-home amounts.
6. Prime cost
Prime cost, % = (food cost + payroll) ÷ revenue × 100
(28,800 + 22,500) ÷ 90,000 × 100 = 57%. These are a restaurant's two biggest and most controllable costs. If food cost drops one point and labour rises one point, nothing has really changed, so watch the two separately and together.
7. Voids, discounts and cash variances
Discount rate, % = discounts ÷ revenue before discounts × 100
Void rate, % = value of voided items ÷ revenue × 100
In the example, discounts come to 1,800 ₼ a month (about 2%) and voids after the bill was printed to 450 ₼ (0.5%). Neither figure is "bad" in itself, but a sudden jump, or most of it sitting with one employee, is a warning sign. Add the cash variance too: the gap between expected and counted cash when a shift closes. See our guide to X and Z reports for closing a shift properly, and the article on restaurant theft prevention for the usual schemes.
8. Losses: write-offs and stock count variance
Write-off rate, % = cost of write-offs ÷ cost of goods sold × 100
In the example, write-offs are 860 ₼ a month: 860 ÷ 28,800 × 100 ≈ 3%. Track the stock count variance separately: a 430 ₼ shortage at month end, say, is 1.5% of cost of goods sold. A write-off is an explained loss; a count shortage is an unexplained one. Don't merge them into a single number. More in our articles on food write-offs and the restaurant inventory count.
9. Dish margin and menu position
Dish margin, ₼ = selling price − cost per portion
Plov sells for 12 ₼ with a portion cost of 3.60 ₼: a margin of 8.40 ₼ at 30% food cost. Lula kebab sells for 14 ₼ and costs 5.60 ₼: the same 8.40 ₼ margin, but at 40% food cost. A dish that looks expensive in percentage terms can earn just as much in manat. What a dish really brings in is its margin multiplied by the number sold. To sort your menu into stars, plowhorses, puzzles and dogs, see our article on restaurant menu engineering. Once a month is enough for this one.
10. Net profit and break-even
Net margin, % = net profit ÷ revenue × 100
Break-even revenue = fixed costs ÷ (1 − variable cost share)
In the example, profit before tax is 90,000 − 28,800 − 22,500 − 17,100 = 21,600 ₼, or 24%. Tax depends on your regime; if we assume 7% of revenue, 6,300 ₼, net profit is 15,300 ₼, or 17%. Our article on restaurant taxes in Azerbaijan explains the regimes.
Fixed costs (payroll and other fixed costs) are 39,600 ₼; variable costs (food cost and turnover tax) are about 39% of revenue: 39,600 ÷ 0.61 ≈ 65,000 ₼ a month. That is roughly 2,160 ₼ a day, or 108 guests at a 20 ₼ average check. A month below that line closes at a loss. We build the full P&L step by step in restaurant profit margin.
DISHMENT
Want to see this in your restaurant?
We'll show you Dishment on your own menu in 30 minutes.
Free demoAll ten in one table: when to check and who owns it
| KPI | How often | Owner | What to watch |
|---|---|---|---|
| Revenue against plan | daily | manager | gap to the same day last week |
| Covers, seat turnover | daily | manager | dead hours and days |
| Average check | daily, by waiter weekly | manager | spread between waiters |
| Food cost | weekly and monthly | head chef | purchase prices, portion sizes |
| Labour cost | weekly | manager | overtime, rota out of step with sales |
| Prime cost | monthly | owner | both costs moving together |
| Voids, discounts, cash variance | daily | manager | clustering on one person or shift |
| Write-offs and count variance | weekly and monthly | head chef, storekeeper | expensive items, repeat variances |
| Dish margin | monthly | owner, head chef | dishes that don't sell or barely earn |
| Net profit, break-even | monthly | owner | plan and the same month last year |
Fill this table in with your own numbers and update it every month. Nobody reads a 40-line report; everyone understands a 10-line table.
The weekly management meeting: a 30-minute agenda
Numbers only help when people discuss them. Once a week, same day and time, sit down with the manager and the head chef:
- Last week's revenue, covers and average check, against plan and the week before (5 minutes).
- Food cost: a count of the 10 most expensive items and any change in purchase prices (5 minutes).
- Labour: time sheet, overtime, next week's rota against the sales forecast (5 minutes).
- Voids, discounts and cash variances: the five largest cases (5 minutes).
- Guest reviews and complaints (5 minutes).
- One decision, one owner, one deadline (5 minutes).
Write the decision down at the end and open the next meeting with its result. You can print this list and pin it up in the office.
Common restaurant management mistakes
- Too many KPIs. Measuring everything means watching nothing. Start with ten.
- Treating revenue as profit. "We took 3,000 ₼ today" says little until food, wages, rent and tax come out of it.
- Seeing the numbers too late. A report put together two weeks after month end only describes the past.
- Comparing the wrong periods. Compare a month with Novruz or New Year in it with the same month last year, not with an ordinary month.
- Using KPIs to punish. When a number is used against people, they start fixing the number instead of the process.
- Forgetting your own work. If you manage the restaurant yourself, put a market salary for that job into payroll, or your profit is overstated.
Spreadsheets or a system
You can track these 10 KPIs in Excel. The catch is that every week someone has to pull figures from the till, supplier invoices, time sheets and expense receipts by hand, and that job keeps slipping. In Dishment most of these numbers come straight out of the day's work:
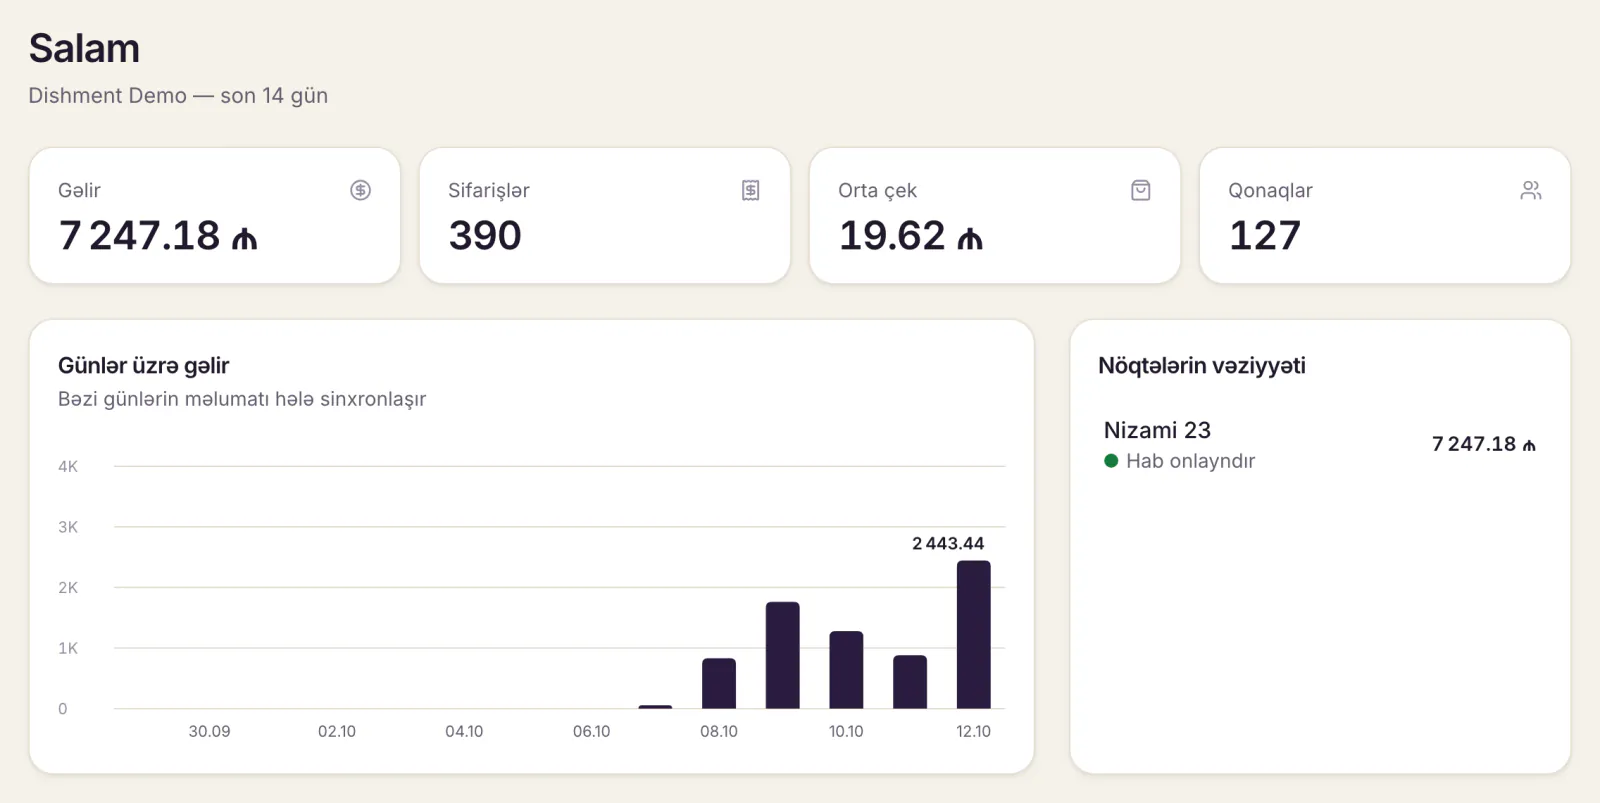
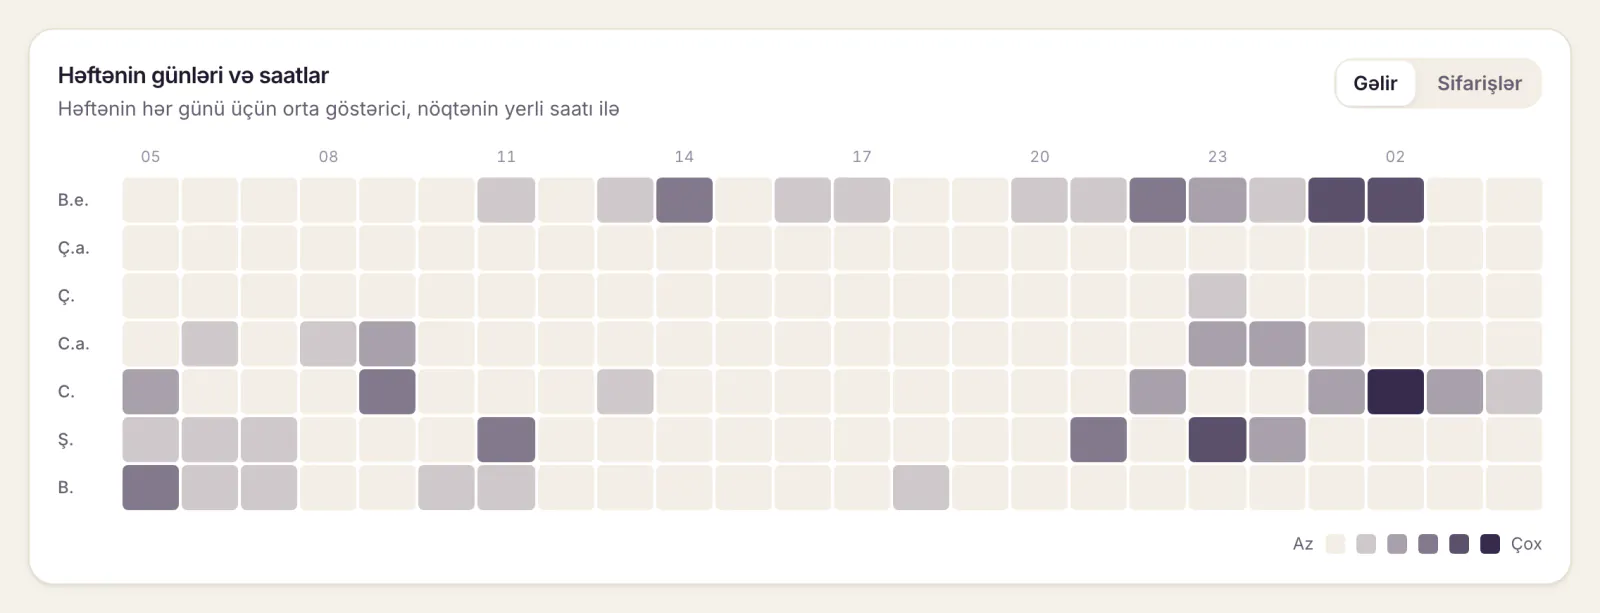
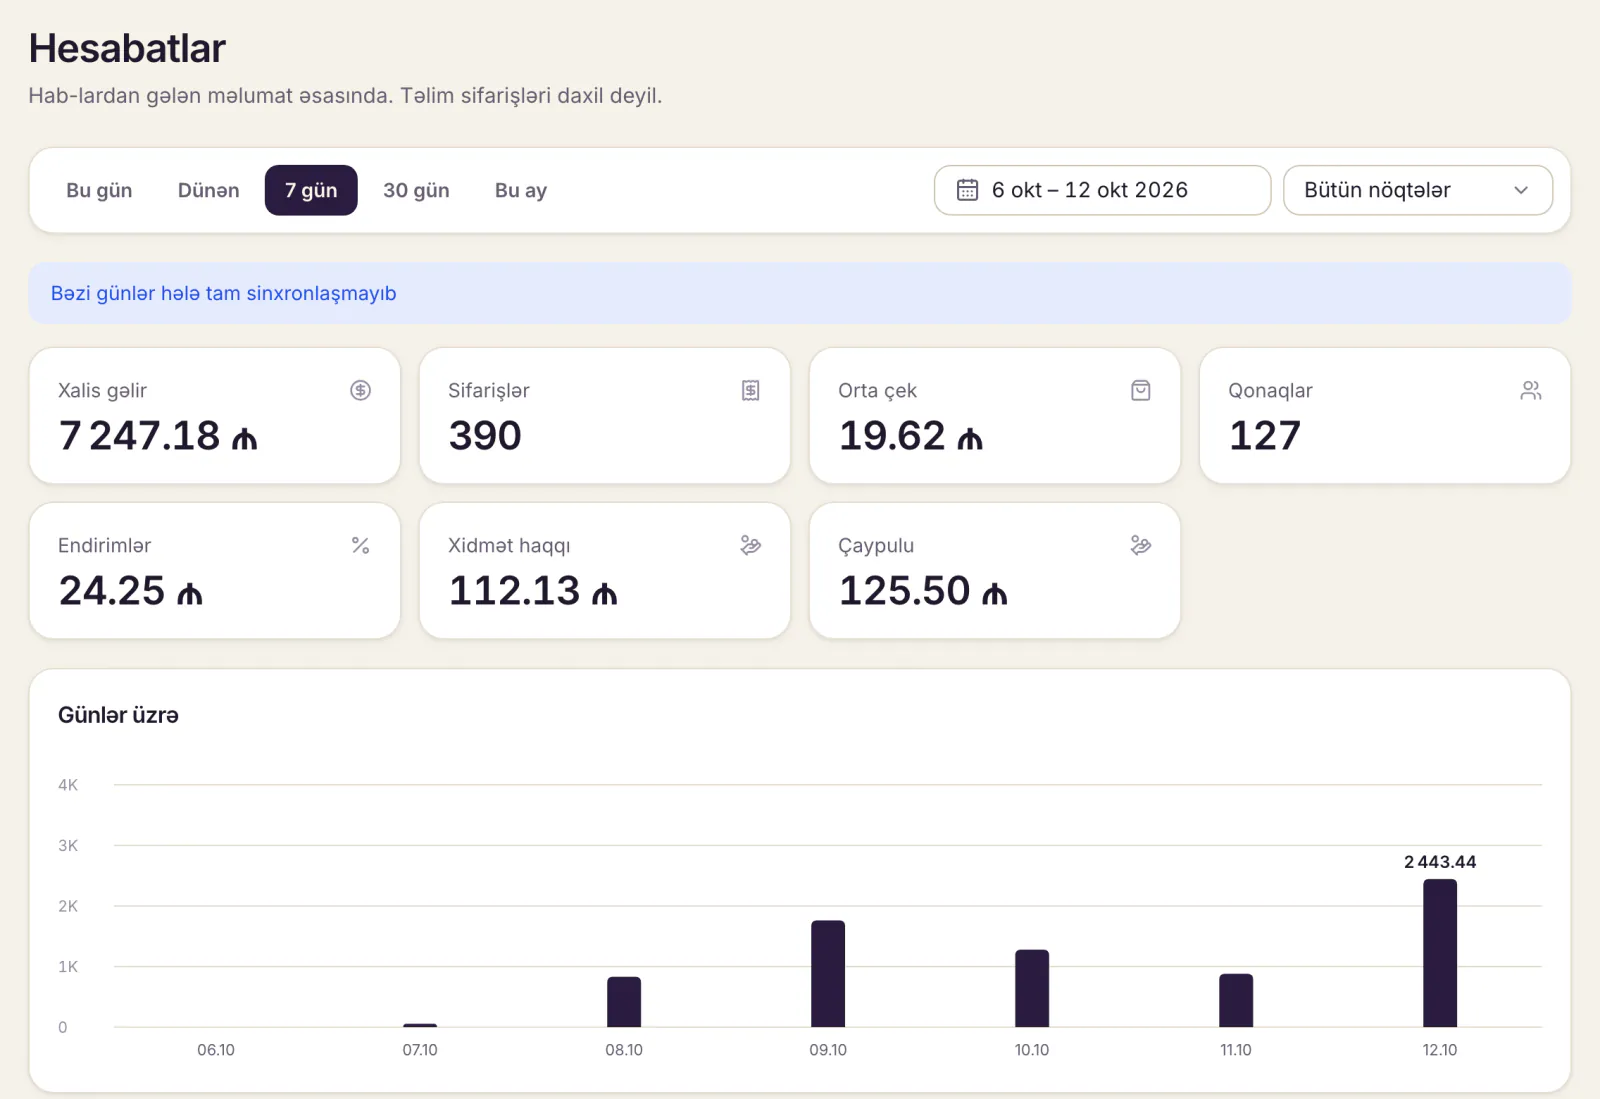
- Reports, in every plan: revenue, days, dishes, staff, voids, orders, tables and cash shifts, plus a venue dashboard and chain overview. The Advanced reports module adds Live, with today's revenue, guests and average check as payments go through, and analytics: revenue by hour, a heatmap, ABC analysis, period comparison and waiters.
- Inventory and recipes: cost and margin for every dish, cost of goods sold and gross profit, and an ingredient consumption report with write-offs and count variances shown separately.
- Staff and payroll: rota, clock-in at the till, time sheets and payroll, which is where your labour cost comes from.
- Finance: profit and loss by month and venue, cash flow and recurring payments. This is management accounting for the owner and does not replace bookkeeping or tax reporting.
- Theft and loss control: voids after the bill, reopened checks and cash shortages.
- Notifications: when the day closes, revenue, orders, average check, payment methods, voids and refunds arrive in Telegram.
Prime cost and break-even you work out yourself from these figures, using the formulas above. With several venues, multi-location lets you compare them on one screen. Module prices are on the pricing page.
FAQ
Where should restaurant management start?
With three numbers: revenue, food cost and labour cost percentage. Calculate them the same way for a month, then add the rest.
Which restaurant KPI matters most?
There is no single one. Prime cost shows your two biggest costs together, and net profit shows the result of every decision.
How often should I review restaurant KPIs?
Revenue, covers, average check and cash variance daily; food cost, labour, voids and discounts weekly; profit, losses and the menu monthly.
What is a normal food cost for a restaurant?
There is no official figure that fits everyone: concept, menu and prices move it a lot. Measure your own for two or three months and set the target from there.
Is there a ready-made KPI checklist?
Copy the KPI table and the meeting agenda above into Word or Excel and save it as a PDF. Adding your own numbers is easier that way than adapting someone else's file.
DISHMENT
Try it free for 30 days
We open the account and move your menu over together. No card needed.
30 days free